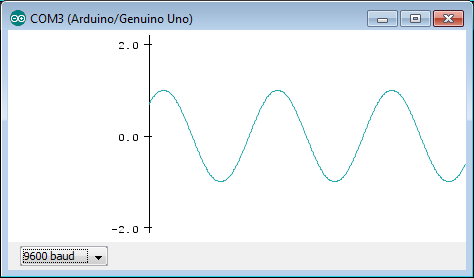
Version 1.6.6 of the Arduino IDE is upon us, and with it – among other novelties – is the Serial Plotter, a basic graphing utility for visualizing data, debugging and show-off. What is it, and how to use it? Here’s a little guide…

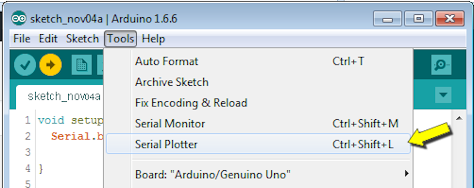
To open the Serial Plotter, Choose Tools->Serial Plotter in the main menu (or click Ctrl+Shift+L in Windows). Assuming there’s an Arduino connected, the plotter window will open up. There, at the bottom left, you can select the baud rate – just like you would for the good old Serial Monitor. Other than that, everything is automated – you can’t define, change or manage anything else. This is the Arduino simplicity at its best; if you have more complex requirements, there are plenty of advanced tools and products out there.

Data
The Serial Plotter plots numbers as they arrive on the serial connection. For a number to be considered valid for display, it has to be:
- In text form (e.g. the three character sequence “123” for one-hundred and twenty three). Don’t worry about this too much – when you Serial.println(x) and x is a number, it will be sent in text form.
- Without any preceding or trailing graphical characters (apparently you can surround the number with ASCII characters #0 – #32, inclusive, but why would you?)
- Terminated with the usual end-of-line characters (those that are sent automatically by Serial.println).
The numbers can be negative, floating point, big or small, But they have to be in base 10.
Axes
The graph’s X axis is invisible, and it represents only the order in which valid numbers arrived, from left to right. It does NOT take time into account. You can stretch the Plotter window, but the graph will always show 500 numbers. As more numbers arrive, the graph scrolls and there’s no way to go back.
The Y axis adjusts dynamically to the minimum and maximum of the incoming numbers, and adds a safety margin as well in both directions.
Data points are drawn in blue, and connected with blue lines.
Example
Here’s a little inefficient Arduino sketch to draw a basic sine wave on the Serial Plotter:
void setup() {
  Serial.begin(9600);
}

void loop() {
  for (int j = 0; j < 360; j++) {
   Serial.println(sin(j * (PI / 180)));
  }
}
Disclaimer
Everything I wrote here is based on my own early experiments with the Serial Plotter, without even reading its source code yet. Comments and corrections are welcomed!
Update: Here’s a short video I made about Arduino’s Serial Plotter.

Hello, can you help me how to display PID controller graph on serial plotter Arduino? I have the correct source code but I can’t display the graph that I want. I’m really glad if you will help me!
Well, “Can’t display” is kind of a vague statement, and obviously the source code is not “correct” or you wouldn’t need assistance… 🙂 Anyway this plotter is a really poor tool, and there aren’t many useful things you can do with it. I suggest looking for another plotter which can take serial input.
Hello,
I’m using an adafruit 32u4 in plotter mode.
I wanted to display Hexadecimal using the plotter mode configuration.
Here is the git link for the code:
https://github.com/adafruit/Bluefruit_LE_Connect_Plotter.git
How can I modify the code?
Awaiting your response,
AK
Wouldn’t it make more sense to ask this at the Adafruit forums?
I want to convert square to sine, output PWM
If I understand correctly, you simply need to send to the analogWrite() function values that follow a sine wave – but of course, you’ll have to map these from the range -1..1 to 0..255. To make it fast, prepare a lookup table in advance for the correct values. Calculating them in real time is too demanding for an Arduino.
I upload your program to stm32
but i have nothing on the serial plotter window.
STM32 is not a “native” Arduino product, and I have no idea what goes on there so I can’t help you with that – you should probably try asking on stm32duino.com .
Thanks
I have another question, how to implement your code to square wave generator so I will have two outputs , square and sine
HardwareTimer pwmtimer2(2);
void setup() {
pinMode(A0, PWM); // square
pinMode(A1, PWM); //sine
pwmtimer2.pause();
pwmtimer2.setPrescaleFactor(10);
pwmtimer2.setOverflow(1000-1);
pwmtimer2.setCompare(TIMER_CH4, 500);
pwmtimer2.refresh();
pwmtimer2.resume();
}
Hi, I’m not sure what you are asking – the Arduino doesn’t have real analog outputs, I just wrote the values as text for the serial plotter.
If you already have a variable following a sine, let’s call it S, you can set another variable and flip its value (from 0 to 1 or vice versa) whenever S==0, this will produce an equivalent square wave.